LRGE (pronounced “large”) estimates genome size directly from long read sequencing data, without assembling the reads into a genome first. We published the paper in 2025 [1], and since then I’ve been working on cases where its estimates go wrong. Those changes are now available in version 1.0.0.
The biggest changes are depth normalisation and more selective filtering of internal matches caused by repeats. Getting those working also led to improvements in runtime and memory use, and uncovered a bug that had been affecting every PacBio estimate.
How LRGE estimates genome size
LRGE estimates genome size from the probability that two randomly sampled reads overlap. For a given read count and read length distribution, a larger genome gives fewer overlaps.
By default, LRGE samples 10,000 target reads and 5,000 query reads, then uses minimap2 to find overlaps between the two sets. For each query, it estimates genome size from the number of target reads it overlaps, accounting for the query’s length, the mean target length and the minimum overlap length. The final answer is the median of these per-read estimates. Sampling two sets keeps the overlap work manageable.
The calculation assumes reads sample genome positions roughly uniformly. High-copy plasmids and gene amplifications can break that assumption.
When a small part of the genome dominates the reads
Some of the examples in the paper were extreme. An Enterobacter ludwigii dataset (SRR12247681) had two plasmids at 50,000× and 160,000× depth.
With such uneven depth, a small part of the genome can supply most of the reads. Random sampling can therefore select mostly reads from the overrepresented sequence, which means we essentially end up estimating the size of that region instead of the whole genome (issue #29).
Normalising with minimizer counts
LRGE now uses minimizer counts to detect uneven depth and adjust read selection. During the initial pass that counts input reads, it computes minimizers for about 1% of them. A count-min sketch stores approximate minimizer frequencies. The detector compares the 99.9th percentile count with the median; a ratio of at least 16 triggers normalisation.
For a skewed input, an additional pass builds a depth profile across all reads. The full input counts of minimizers sampled during detection give a baseline median depth, $m$. Each read then gets its own depth estimate, $d$, from the median count of its sampled minimizers. These counts are proxies for depth, obtained without mapping to a reference. The probability that a read survives normalisation is:
$p = min(1, \frac{2m}{d})$
A read at or below twice the baseline depth passes this step automatically. Above that, retention falls inversely with depth: if $m = 20$, a read with $d = 200$ has a 20% chance of surviving. LRGE then samples the target and query sets from the retained pool. Passing normalisation therefore doesn’t mean a read will necessarily enter either final set.
Depth normalisation is essentially an attempt at “flattening” the depth profile across the genome, without a reference.
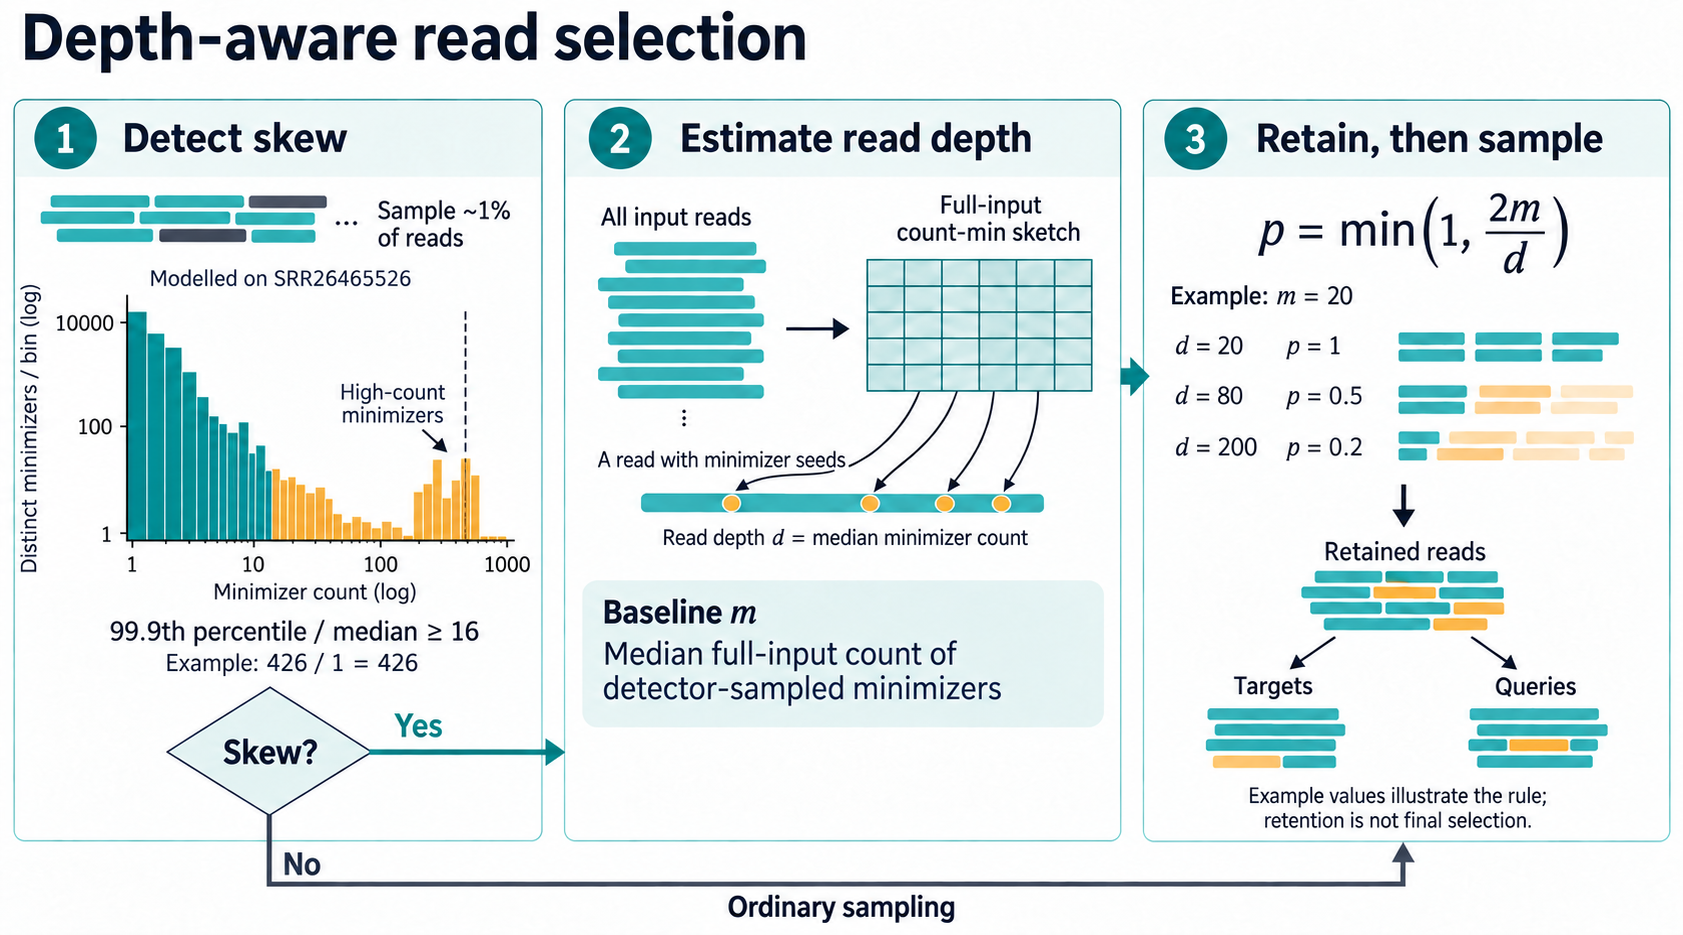
Figure 1: How minimizer counts guide read selection. Panel 1 is modelled on SRR26465526 (measured histogram, counts); both axes are logarithmic. The smaller right-hand bump contains distinct minimizers that each occur many times. Panel 3 uses illustrative values.
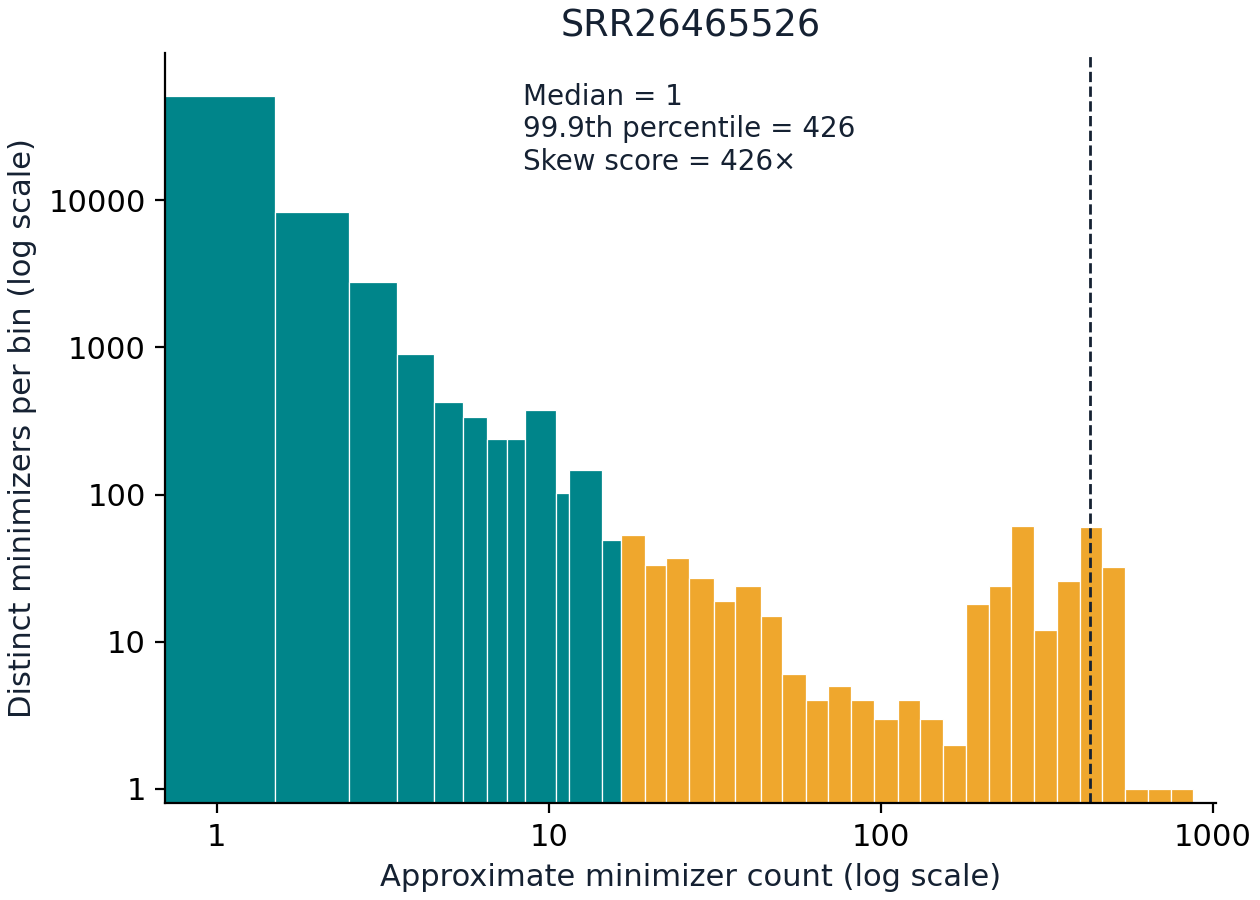
For this sample, normalisation changed the genome size estimate from 27 Kb to 2.21 Mb, compared with a true genome size of 2.23 Mb. The small high-count population in the histogram is enough to flag a read set as having potential depth skew.
Normalisation reduces the overrepresentation of high-copy sequence without needing a reference genome or knowing which reads belong to a plasmid. It is on by default through
--normalize auto.
The detection threshold and retention multiplier are both new with normalisation in v1. I tested combinations across the full bacterial benchmark ($n=3,370$) and additional low-depth datasets. A broad range performed similarly (see the parameter experiments for the full comparison).
Keeping normalisation cheap
Checking the depth and scoring reads adds work, so a fair bit of the development went into making that work cheaper (runtime and memory frugal).
Separating detection from profiling means most inputs avoid building the full depth profile. Within the sketch, minimizers are subsampled consistently by their hash, so a selected minimizer is counted wherever it occurs. This reduces the number of counter updates. The counters touched by each minimizer also share a cache line, reducing scattered memory access.
There was also a surprisingly large cost hidden in extracting canonical minimizer values. The initial normalisation implementation repeatedly packed overlapping k-mers in both forward and reverse-complement orientations. LRGE now packs each minimizer into two bits per base once per pass, then retrieves the k-mer values with shifts and masks. On one test input with eight threads, this reduced the read-selection stage from 15.9 seconds to 5.8 seconds, with exactly the same estimate.
Building the depth profile and scoring reads also uses multiple threads. Scoring can happen in parallel while the final random selection still processes reads in their original order. That lets us use the extra CPU cores without changing which reads a given random seed selects.
Across the 3,370 bacterial read sets in the paper’s benchmark, the normalisation changes added about 2% to runtime at the median. But the slowest run fell from 943 seconds to 452. Reducing the overrepresented reads can leave much less overlap work to do on those slow inputs. It doesn’t make every skewed input faster: among runs where normalisation engaged, the median overhead was about 9%. The full timing results show both sides of that trade.
When to filter internal matches
Repeats cause a different problem. Two reads can share a repeated sequence without coming from the same place in the genome. An alignment in the middle of both reads, with long unaligned tails on either side, is a warning sign for this. LRGE calls these internal matches.
Counting them as overlaps can make a genome look too small. The -F/--filter-contained option can
exclude them, which pushes the estimate upwards. On an initial set of 27 difficult cases, a high
proportion of internal matches looked like a good way to decide when to apply the filter.
Across the full benchmark, however, runs with a high proportion of internal matches generally already overestimated genome size. Filtering made those estimates worse.
That’s why filtering stays off by default. If you enable it with -F, it applies only when
internal matches account for more than 80% of a run’s overlaps; you can also set that threshold
yourself. In the threshold experiment, this reduced the number of estimates below half the true
size from 13 to 6, but increased average error overall. The filter experiments explain the threshold tradeoffs.
I’d consider trying it when an isolate from a species with a well-characterised genome size gets
an implausibly low estimate, normalisation hasn’t resolved it, and the -vv log reports a high
internal-match share. Another case is a sample with independent evidence of extensive repeats,
perhaps from an existing assembly, where LRGE estimates much less sequence than expected. In both
cases, the reason to try the filter is evidence of underestimation as well as repeats. A high
internal match share alone is not enough.
The platform flag did nothing
LRGE also reports an size interval based on the spread of its per-read estimates. Normalisation changes that spread, so I needed to check whether the old interval settings still made sense for nanopore and PacBio reads.
While doing that, I found that -P/--platform was being read and printed in the logs, but never
passed to the code that finds overlaps. It always used the nanopore settings, even when the user
requested PacBio.
Passing the platform from the CLI through to the overlap code now selects the minimap2 preset ava-pb for PacBio,
where it previously used ava-ont. That connection gave the biggest accuracy improvement in 1.0.0:
PacBio median absolute relative error fell from 27.2% to 16.1%, and the proportion of estimates within 10% of the true size rose from 13.3% to 26.2%.
All 902 PacBio datasets were re-run with the correct settings, alongside runs using the old settings as a control.
Recalibrating the confidence intervals
LRGE reports a confidence interval alongside its genome size estimate, using lower and upper percentiles of the per-read estimates. With normalisation changing those estimates and the platform bug fixed, I recalibrated the interval bounds on the bacterial benchmark from the paper. Nanopore and PacBio needed different percentiles, so the defaults now mirror the selected platform.
The new intervals contained the true genome size for 95.2% of nanopore datasets and 95.0% of PacBio datasets. For a user, the interval gives a range around the estimate calibrated to contain the true size in about 95 out of 100 comparable datasets. A wide interval indicates that the per-read estimates disagree substantially. The calibration analysis has the fitting details.
How much better are the estimates?
Here is version 0.3.0 against 1.0.0 on the paper’s 3,370 bacterial datasets.1 Absolute relative error measures how far an estimate is from the known genome size, as a percentage, regardless of whether it is too high or too low. Lower is better.
| median absolute relative error | within 10% of the truth | |
|---|---|---|
| 0.3.0, nanopore | 4.84% | 75.1% |
| 1.0.0, nanopore | 4.77% | 76.4% |
| 0.3.0, PacBio | 27.2% | 13.3% |
| 1.0.0, PacBio | 16.1% | 26.2% |
The nanopore improvement comes from depth normalisation, which only engages where it detects skew. The PacBio improvement comes from fixing the platform flag: with the wrong preset still in place, normalisation left its median error at 27.2%.
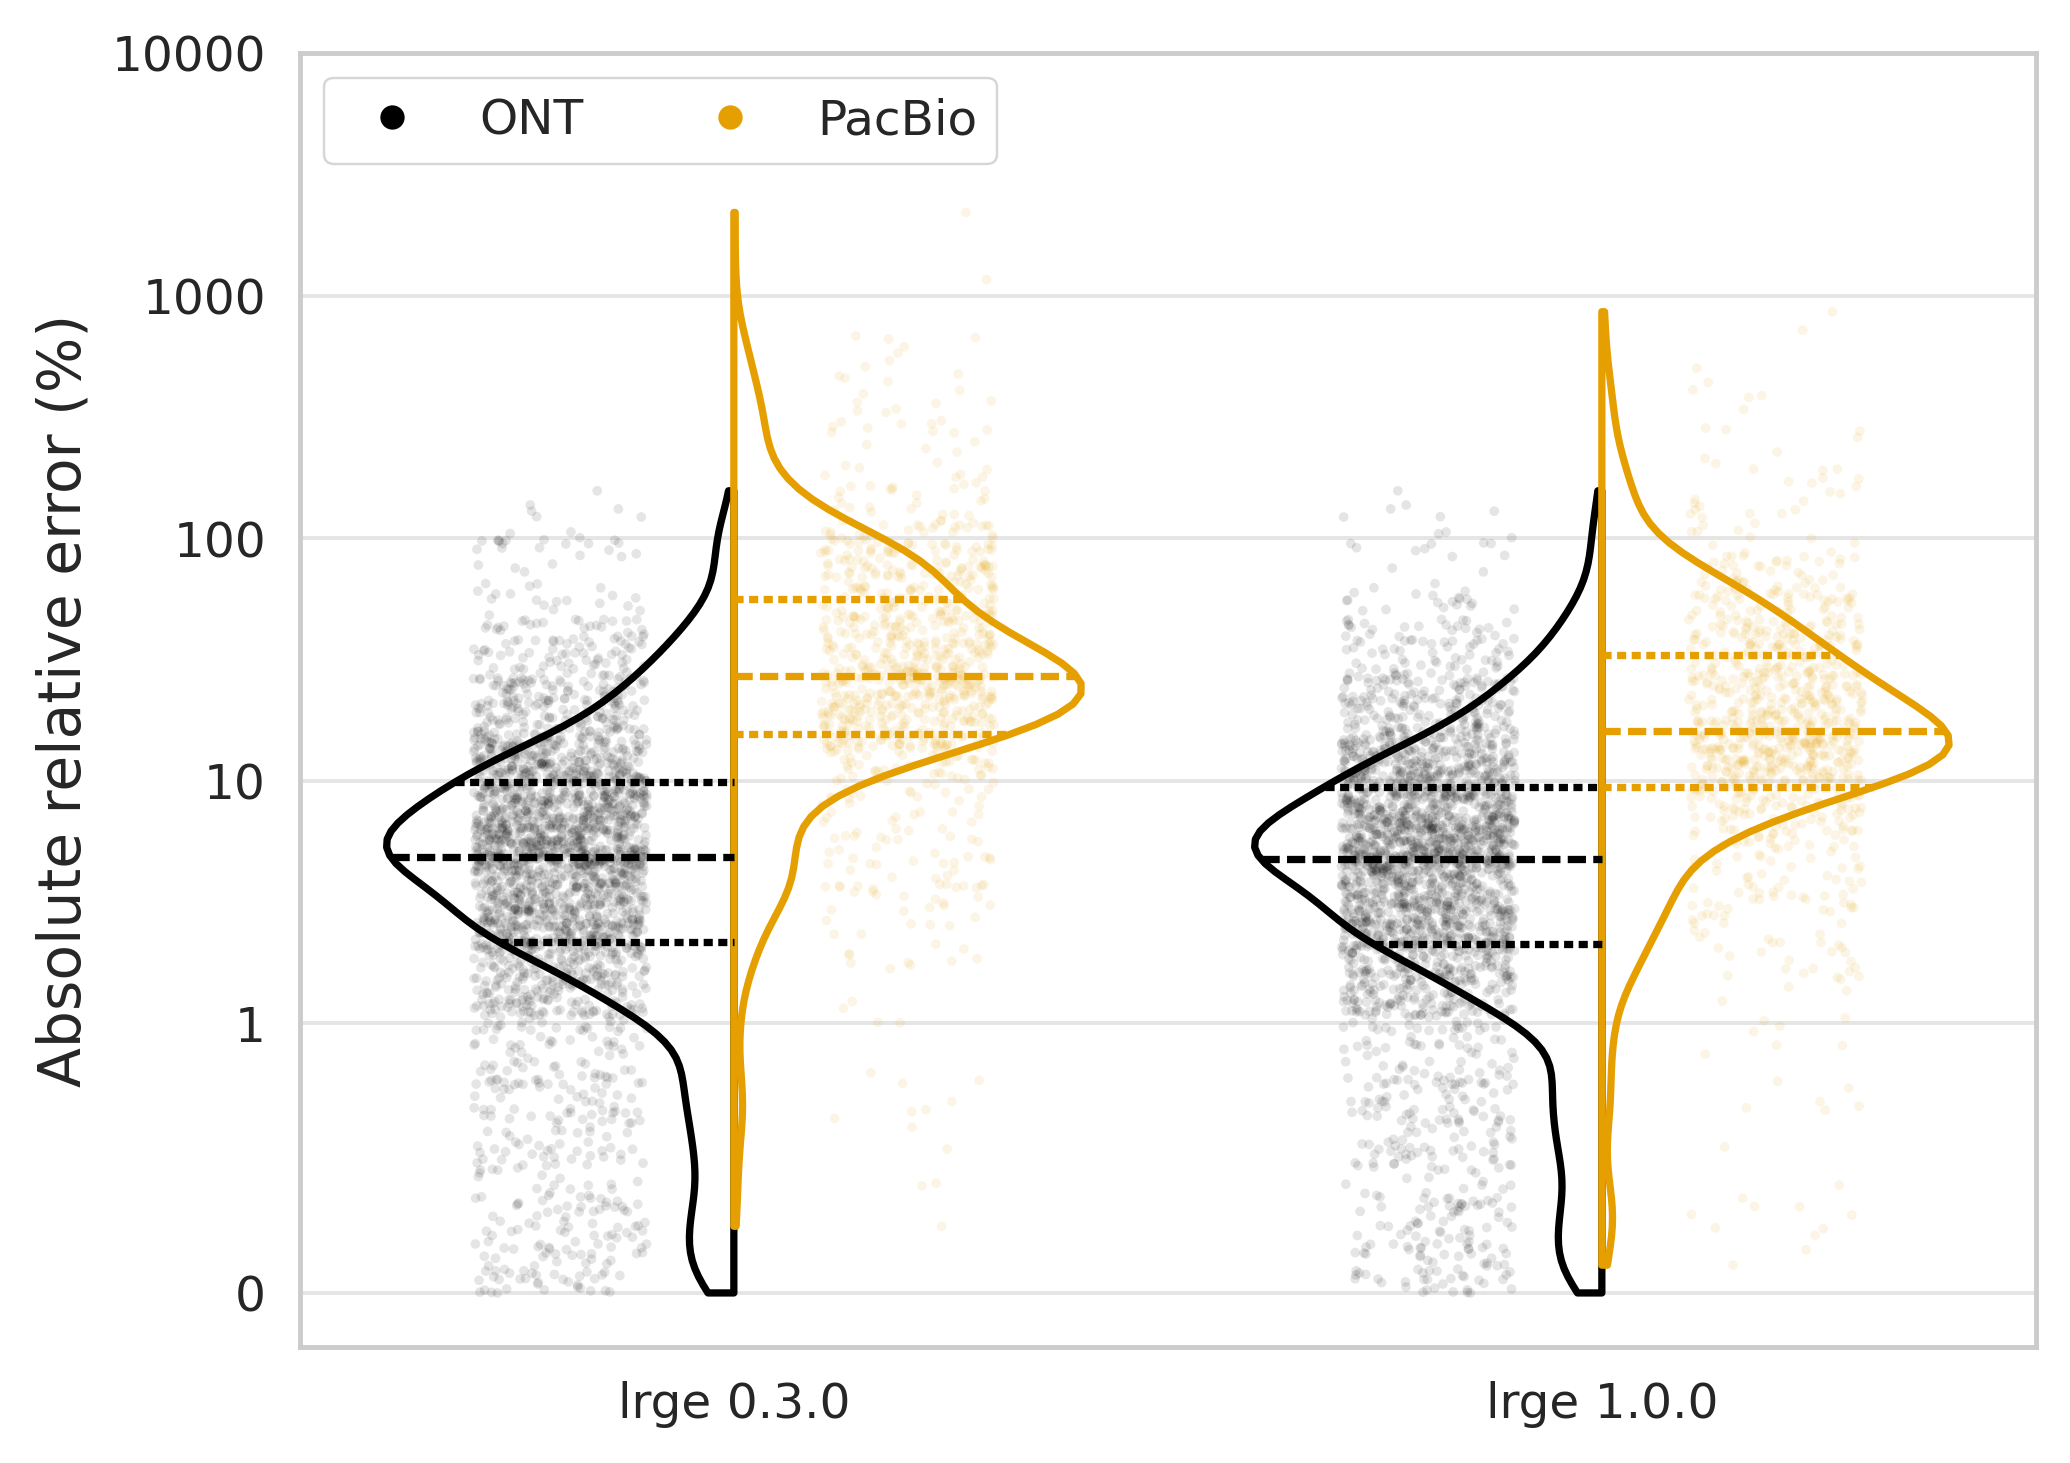
Figure 2: Absolute relative error for LRGE 0.3.0 and 1.0.0 on the same 3,370 bacterial datasets. Lower is better. Black is nanopore; orange is PacBio. Dashed lines mark medians, and dotted lines mark quartiles.
Combining both platforms, median error falls from 7.1% to 6.4%, and the proportion within 10% of the truth rises from 58.6% to 62.9%.
Raven, which assembles the reads to estimate genome size, remains more accurate, but at the cost of runtime and memory usage, as shown in the paper’s resource comparison.
PacBio is still the weaker platform for LRGE. Getting about a quarter of its datasets within 10% of the truth is an improvement, but leaves plenty of room for more work.
Installing and upgrading
Version 1.0.0 is available now, with x86-64 and ARM binaries for Linux and macOS. The installation instructions cover those, Cargo, Conda, and containers.
This is a breaking release because the results change. If you’re reproducing the published benchmark, pin the 0.3.x series.
The README covers the other behaviour changes and options, and the changelog
has the release details. For the experiments behind this post, including the ideas that didn’t
work out, see paper/corrections/.
LRGE was re-run on rebuilt benchmark reads; the other methods’ results are retained from the paper. The figure notes and rerun methods document the comparison. ↩︎
References
- Hall, M. et al. (2025). Genome size estimation from long read overlaps. Bioinformatics. [doi:10.1093/bioinformatics/btaf593]