Evaluating minimap2’s lr:hq preset for bacterial nanopore variant calling
Introduction
Oxford Nanopore Technologies (ONT) sequencing accuracy has improved dramatically in recent years. With basecalling models like Dorado v5.2.0 super-accuracy (sup), error rates are consistently hovering around the 1% mark. To match this shift in raw read quality, minimap2[1] introduced the lr:hq preset in version 2.27 (March 2024), which is calibrated for long reads with an error rate of <1%.
This introduction was driven by internal benchmarking from ONT developers (see minimap2 issue #1127) who found that -x map-ont -k19 -w19 -U50,500 maximised both speed and downstream accuracy for high-quality reads. As such, the lr:hq preset was added to mirror those options.
I have had an increasing number of questions about whether people doing variant calling should be using this new preset or not. I don’t like making recommendations without empirical data, so here is my attempt at providing some evidence for which preset should be used.
What are the preset differences
To understand the results that follow, we have to look at the seeding mechanics defined by these presets in minimap2.
map-ont: This is the default preset and was designed for noisier long reads with an expected error rate of ~10%. It uses shorter k-mers (-k15) and samples a dense minimizer window (-w10)1. It is extremely tolerant of repetitive regions, allowing k-mers that occur as little as 10, and up to a million, times (-U10,1000000). It handles high error rates by creating a dense map of seeds to anchor alignments.
lr:hq: This preset was designed for reads with <1% error and requires longer, perfect matches (-k19) and samples them less frequently (-w19)1. Additionally, it caps k-mer occurrences at a maximum of 500 (a big decrease from map-ont) and raises the minimum to 50 (-U50,500). Because the reads are highly accurate, minimap2 does not need a dense seed map to anchor the alignment. It saves compute time and prevents multi-mapping ambiguity by aggressively ignoring repetitive noise.
Methods and data
I have a nice dataset and methodology from our recent paper benchmarking variant calling in bacterial genomes with which to assess the impact of these presets [2]. This post details a direct benchmarking of map-ont against lr:hq. Using Clair3 [3] on both high-accuracy (hac) and sup ONT reads, we ask a simple question:
Does swapping to
lr:hqactually translate to improvements (or regressions) in downstream bacterial variant calling?
While lr:hq is designed for sup reads, I thought it would be interesting to also see how it impacts hac, as I suspect these are the predominant accuracy level for many users.
I have tried to ensure easy reproducibility with this analysis in case I need to revisit for any other assessments in the future. The basic outline of the pipeline is:
- Data: I downloaded the FASTQs from the benchmark paper that were submitted to the SRA. These were basecalled with Dorado model v4.3.0
hacandsup. I used the truth VCFs from our paper (which are stored on Zenodo). - Standardisation: Reads were randomly subsampled to 50x depth (using
rasusa). To guarantee a 1:1 comparison, the same read IDs were extracted from thesupdataset as those chosen for thehacrandom subset dataset. - Alignment and variant calling: Reads were mapped with
minimap2(v2.30) using both presets, followed by variant calling with Clair3 (v1.0.5) using the respective Dorado v4.3.0 models to match the original pipeline from the paper. - Assessment: Variants were filtered and then evaluated against the truth sets using
vcfdist[4] to handle variant representation, and generating precision, recall, and F1 scores.
(Note: The complete set of Bash and Python scripts used to reproduce this workflow are included in the Appendix at the end of this post, as are the accessions for the reads).
Results
| Variant Type | Read Model | Preset | Mean Precision | Mean Recall | Mean F1 Score | Mean F1 Q-Score2 |
|---|---|---|---|---|---|---|
| SNP | hac | lr-hq | 99.997% | 99.790% | 99.892% | 45.46 |
| SNP | hac | map-ont | 99.995% | 99.790% | 99.891% | 45.27 |
| SNP | sup | lr-hq | 99.998% | 99.795% | 99.895% | 50.97 |
| SNP | sup | map-ont | 99.999% | 99.785% | 99.891% | 50.74 |
| INDEL | hac | lr-hq | 99.440% | 97.697% | 98.556% | 24.48 |
| INDEL | hac | map-ont | 99.421% | 97.646% | 98.521% | 24.37 |
| INDEL | sup | lr-hq | 99.980% | 98.594% | 99.281% | 22.05 |
| INDEL | sup | map-ont | 99.968% | 98.581% | 99.268% | 21.89 |
| ALL | hac | lr-hq | 99.985% | 99.739% | 99.861% | 32.79 |
| ALL | hac | map-ont | 99.983% | 99.738% | 99.860% | 32.65 |
| ALL | sup | lr-hq | 99.997% | 99.770% | 99.882% | 35.16 |
| ALL | sup | map-ont | 99.997% | 99.761% | 99.878% | 34.94 |
Across the board, lr:hq is a marginal improvement. For SNPs, the F1 Q-score2 sees a bump of about 0.2 to 0.25. For indels, we see a similar bump of about 0.13 to 0.17. A shift this deep in the decimal points might seem trivial, but ONT is improving so much now that progress is measured by hunting down the last few false calls. These aren’t massive, earth-shattering percentage leaps anymore. But for something like bacterial outbreak tracking where a single SNP can make a big difference, squeezing out those last false calls is important.
When looking at the improvement given by lr:hq on SNPs, we see that for hac, the higher F1 score is driven solely by a small increase in precision (0.002%), with recall remaining the same. In contrast, for sup, the higher SNP F1 score comes from a 0.01% increase in the recall. Though there was a very small decrease in precision (0.001%).
Indels are a little more clear cut. For both hac and sup there is an increase in both precision and recall. These results can visualised in Figure 1 (F1 scores) below and Figures S1 (precision) and S2 (recall) in the Appendix, along with the full results per-sample (Table S1).
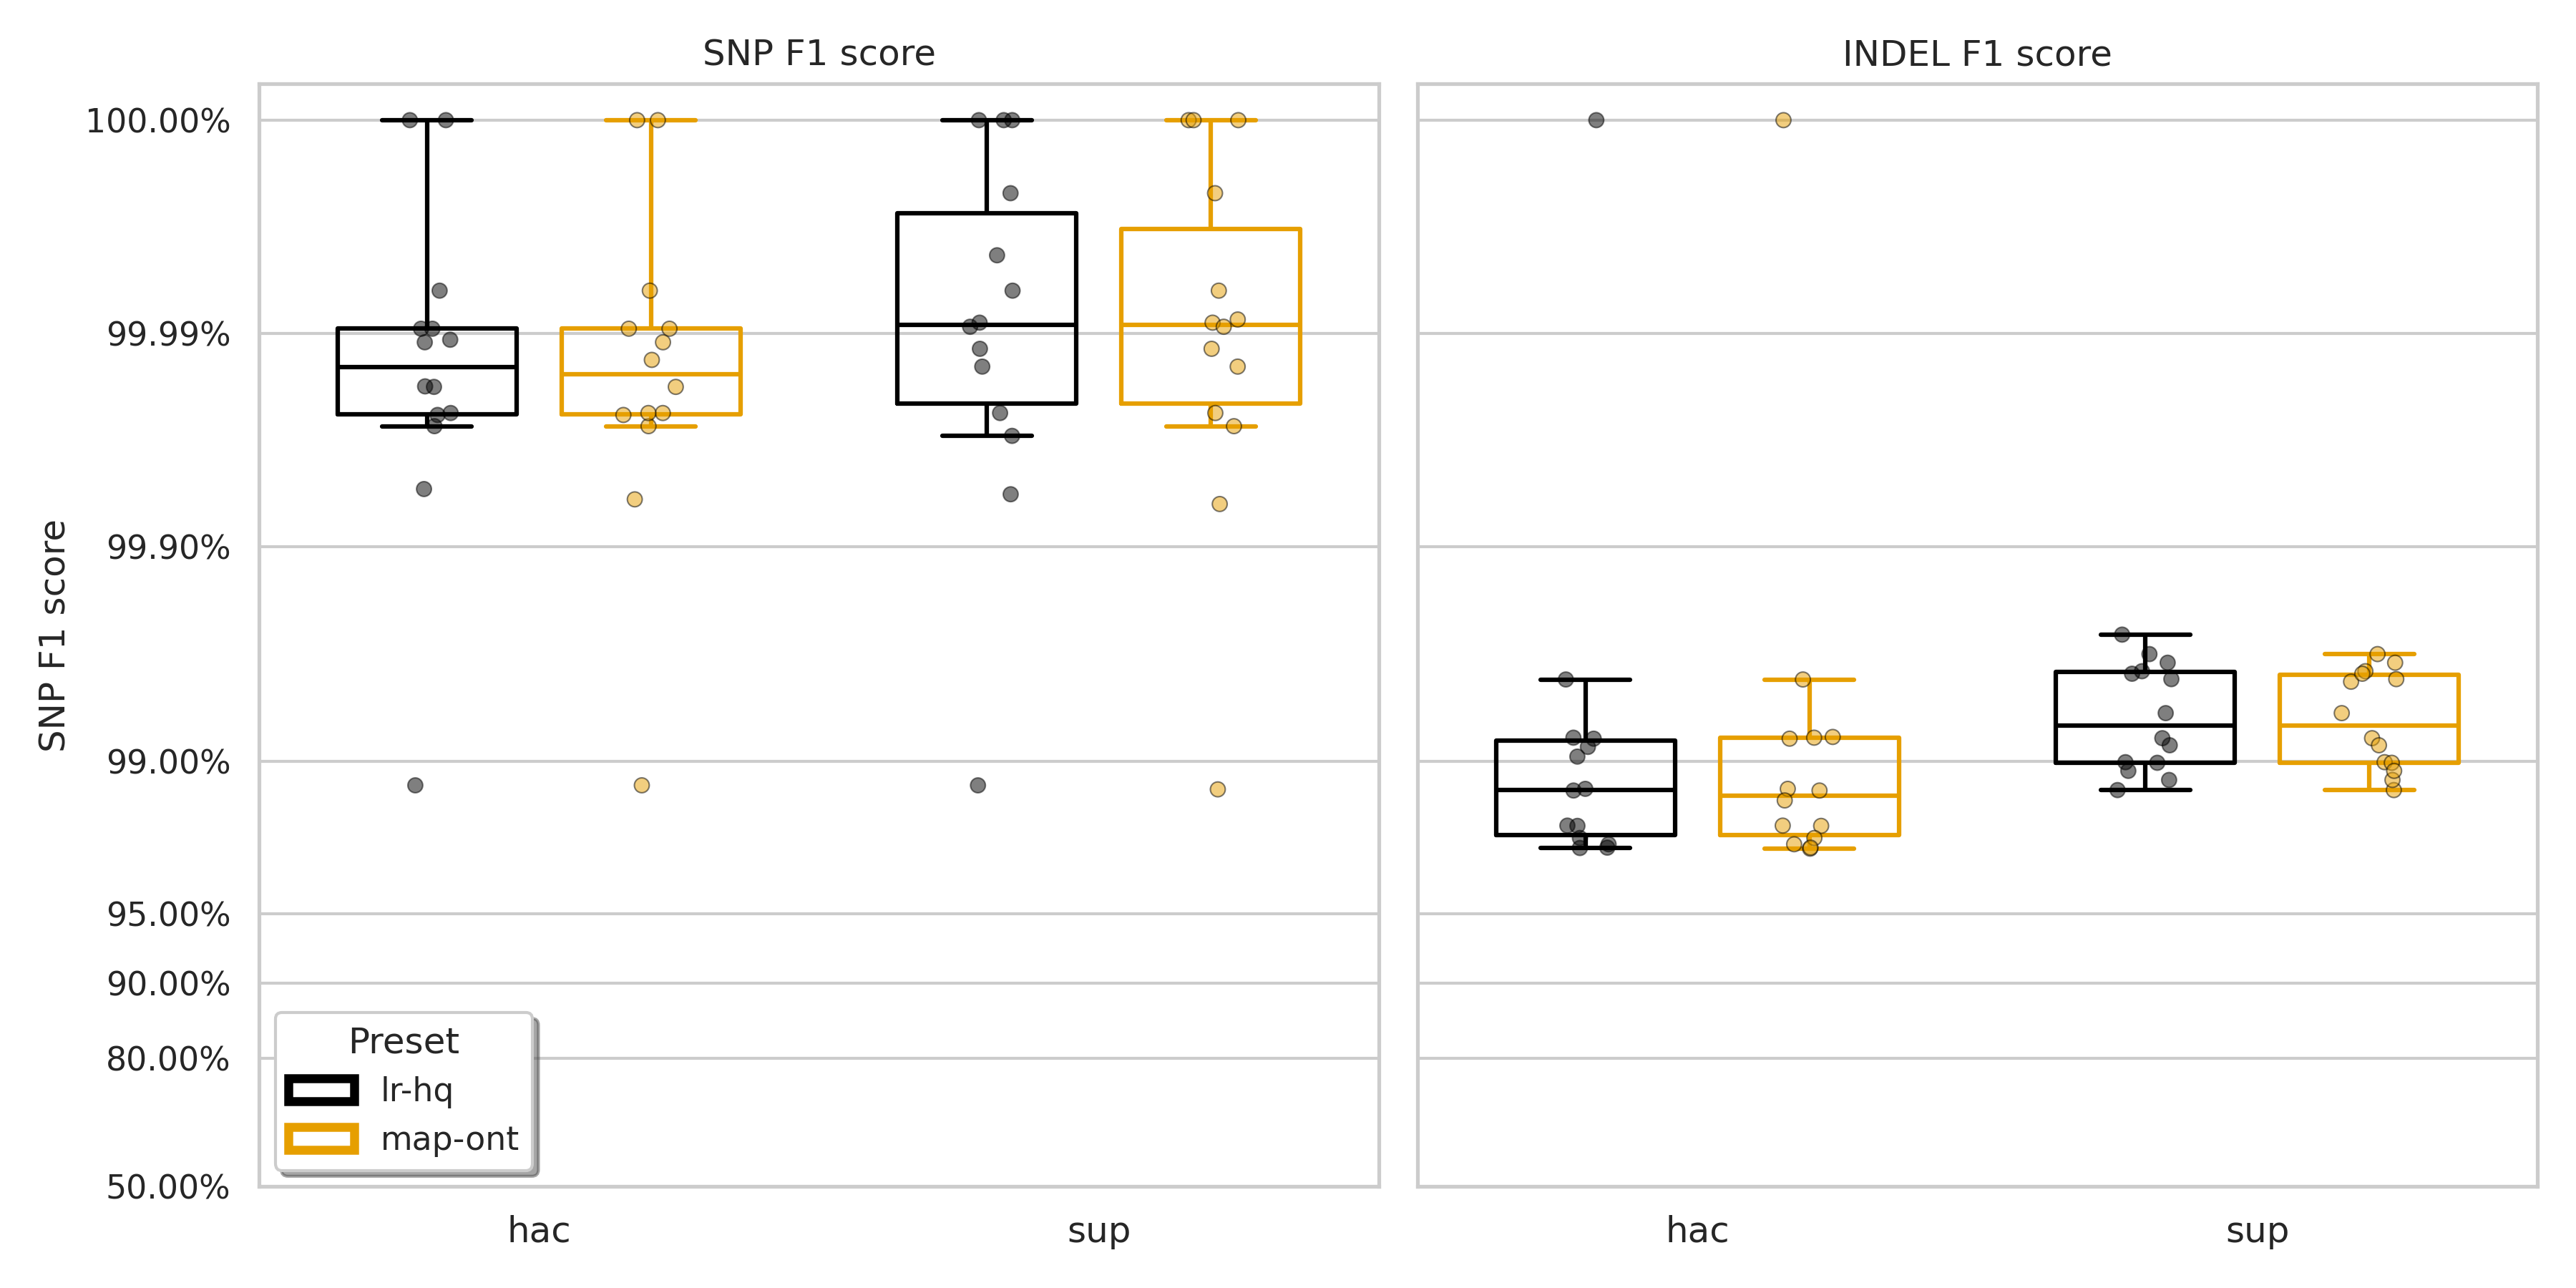
Figure 1: F1 score for SNPs (left) and indels (right) for minimap2 presets lr:hq (black) and map-ont (orange).
Conclusion
If you’re aligning modern sup basecalling (v4.3.0+ models) for variant calling, lr:hq should be your new default. As always, it is worth doing your own assessment on your own data as I am sure there are edge cases for certain difficult genomes/regions. Though as an overarching finding, it seems to be mainly upside with no real downside on this dataset.
The most surprising finding for me though is the (slight) improvement for the hac data. Again, there didn’t seem to be any downside to using lr:hq for these data.
On a final note, Clair3 is a deep learning-based variant caller. So it is very possible that it “hides” some of the benefits (and drawbacks) of these different alignment presets. Having said that, as we point out in our benchmarking paper [2], Clair3, and the other deep learning-based variant callers, provide much better variant calls than traditional callers. My point here is around ensuring these results are taken purely in the context of variant calling; I cannot make claims about how these presets will impact other applications of read alignment.
Appendix
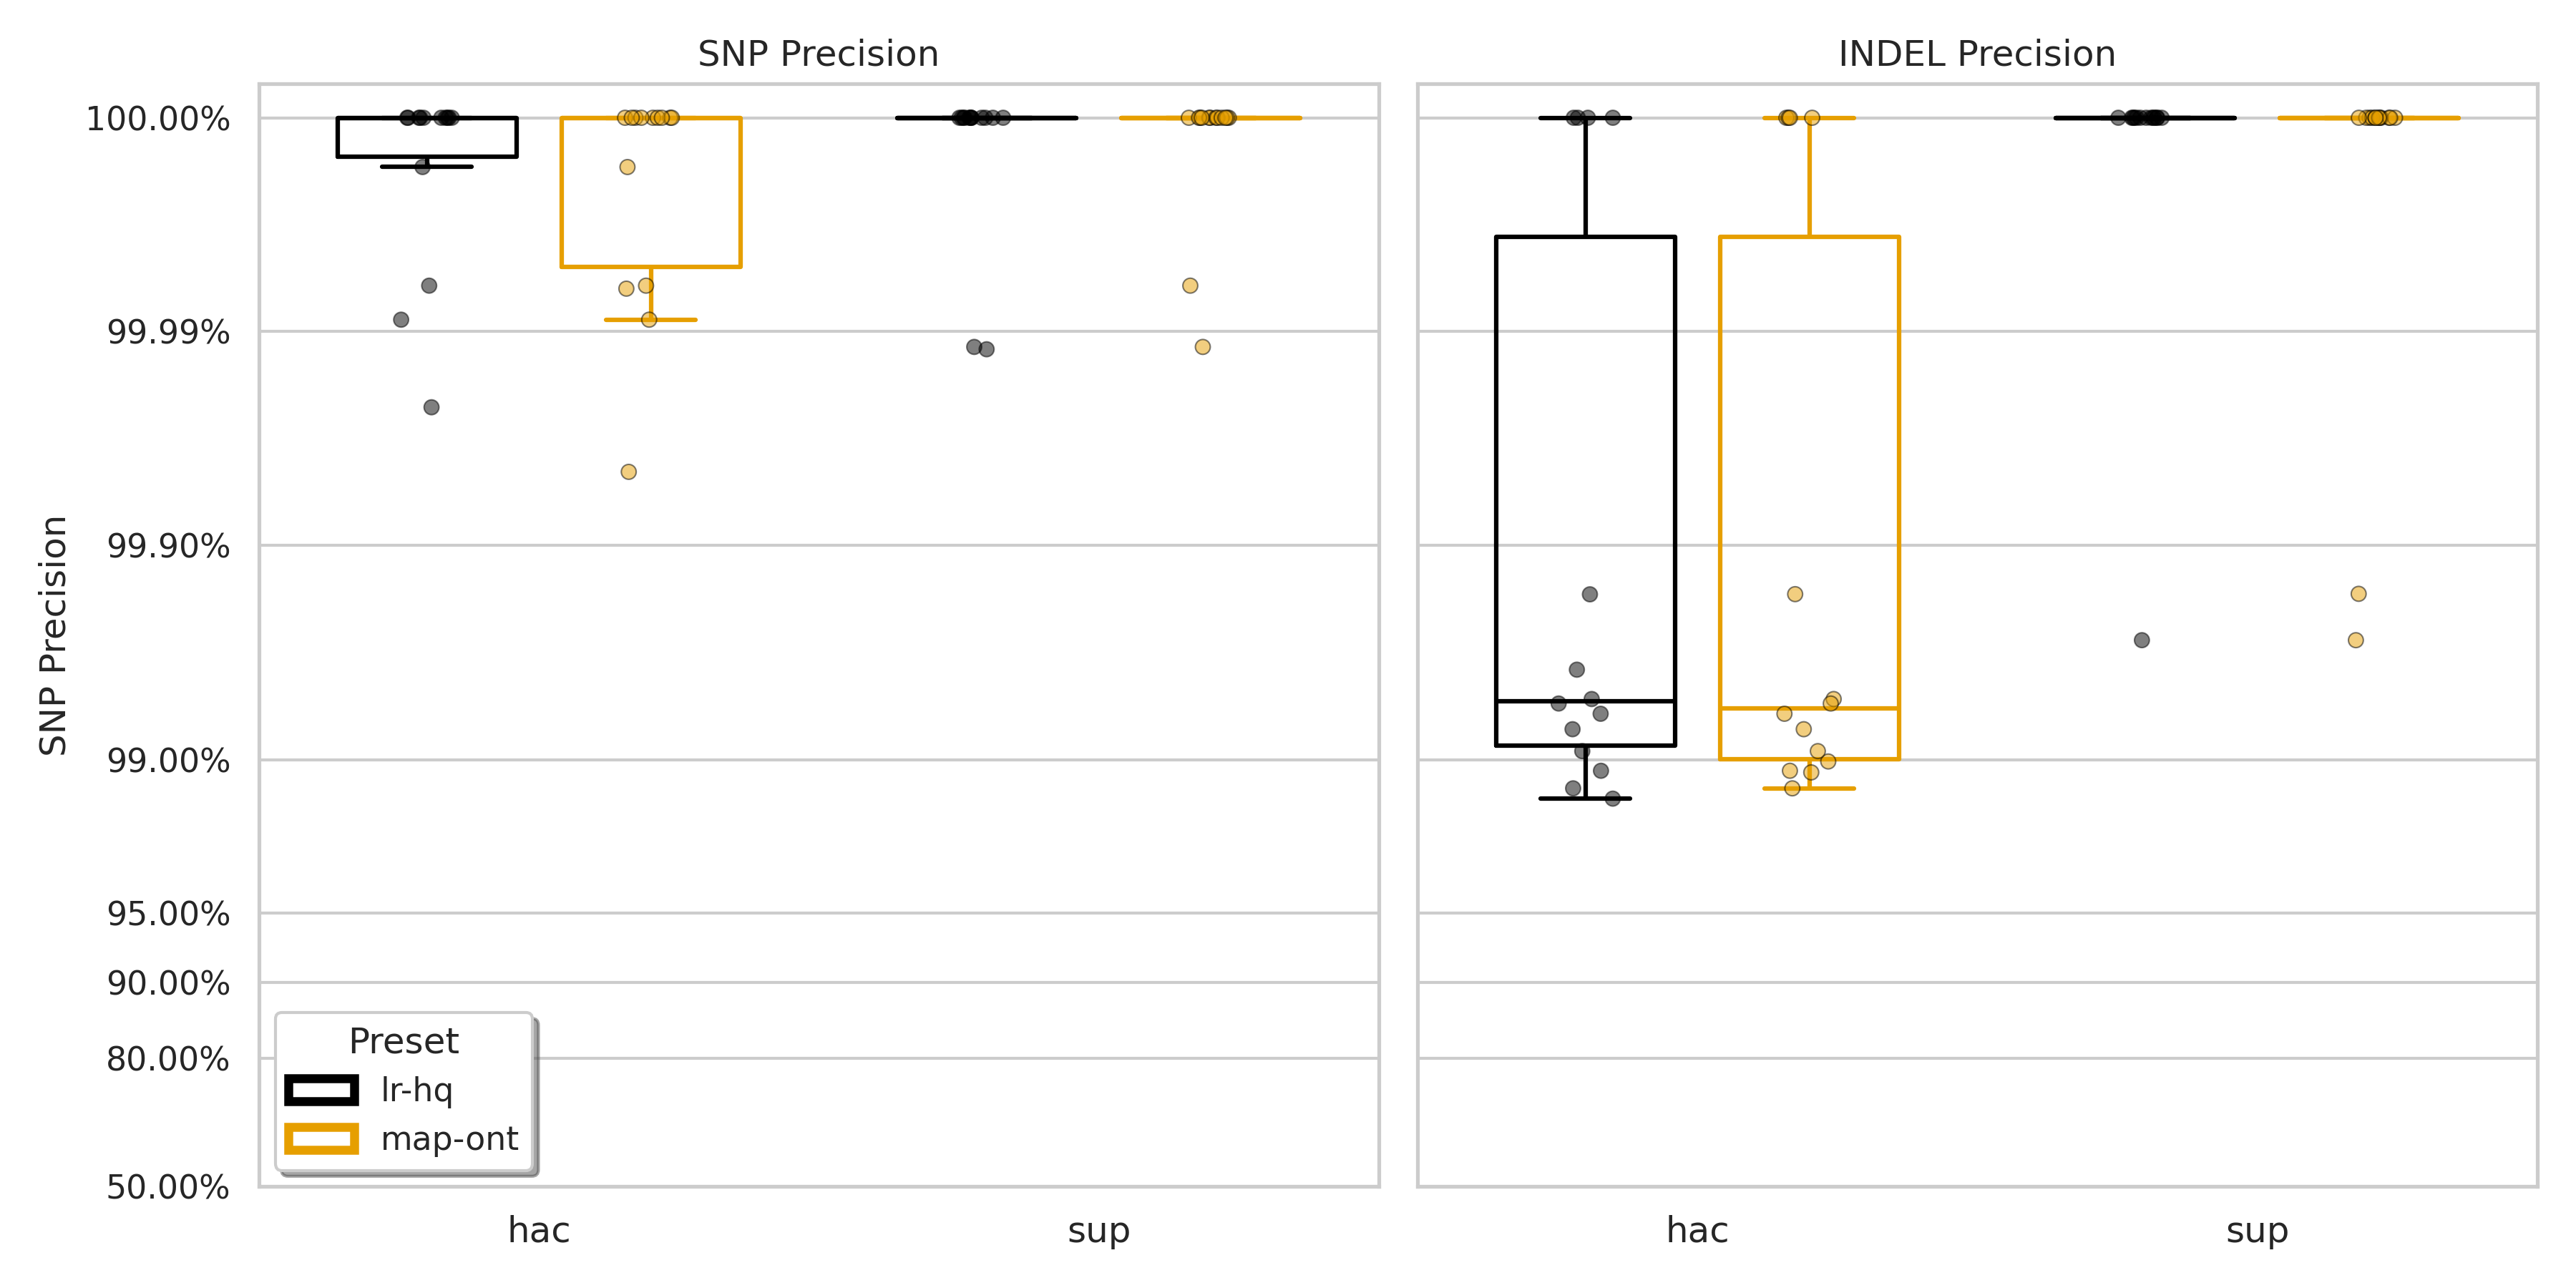
Figure S1: Precision for SNPs (left) and indels (right) for minimap2 presets lr:hq (black) and map-ont (orange).
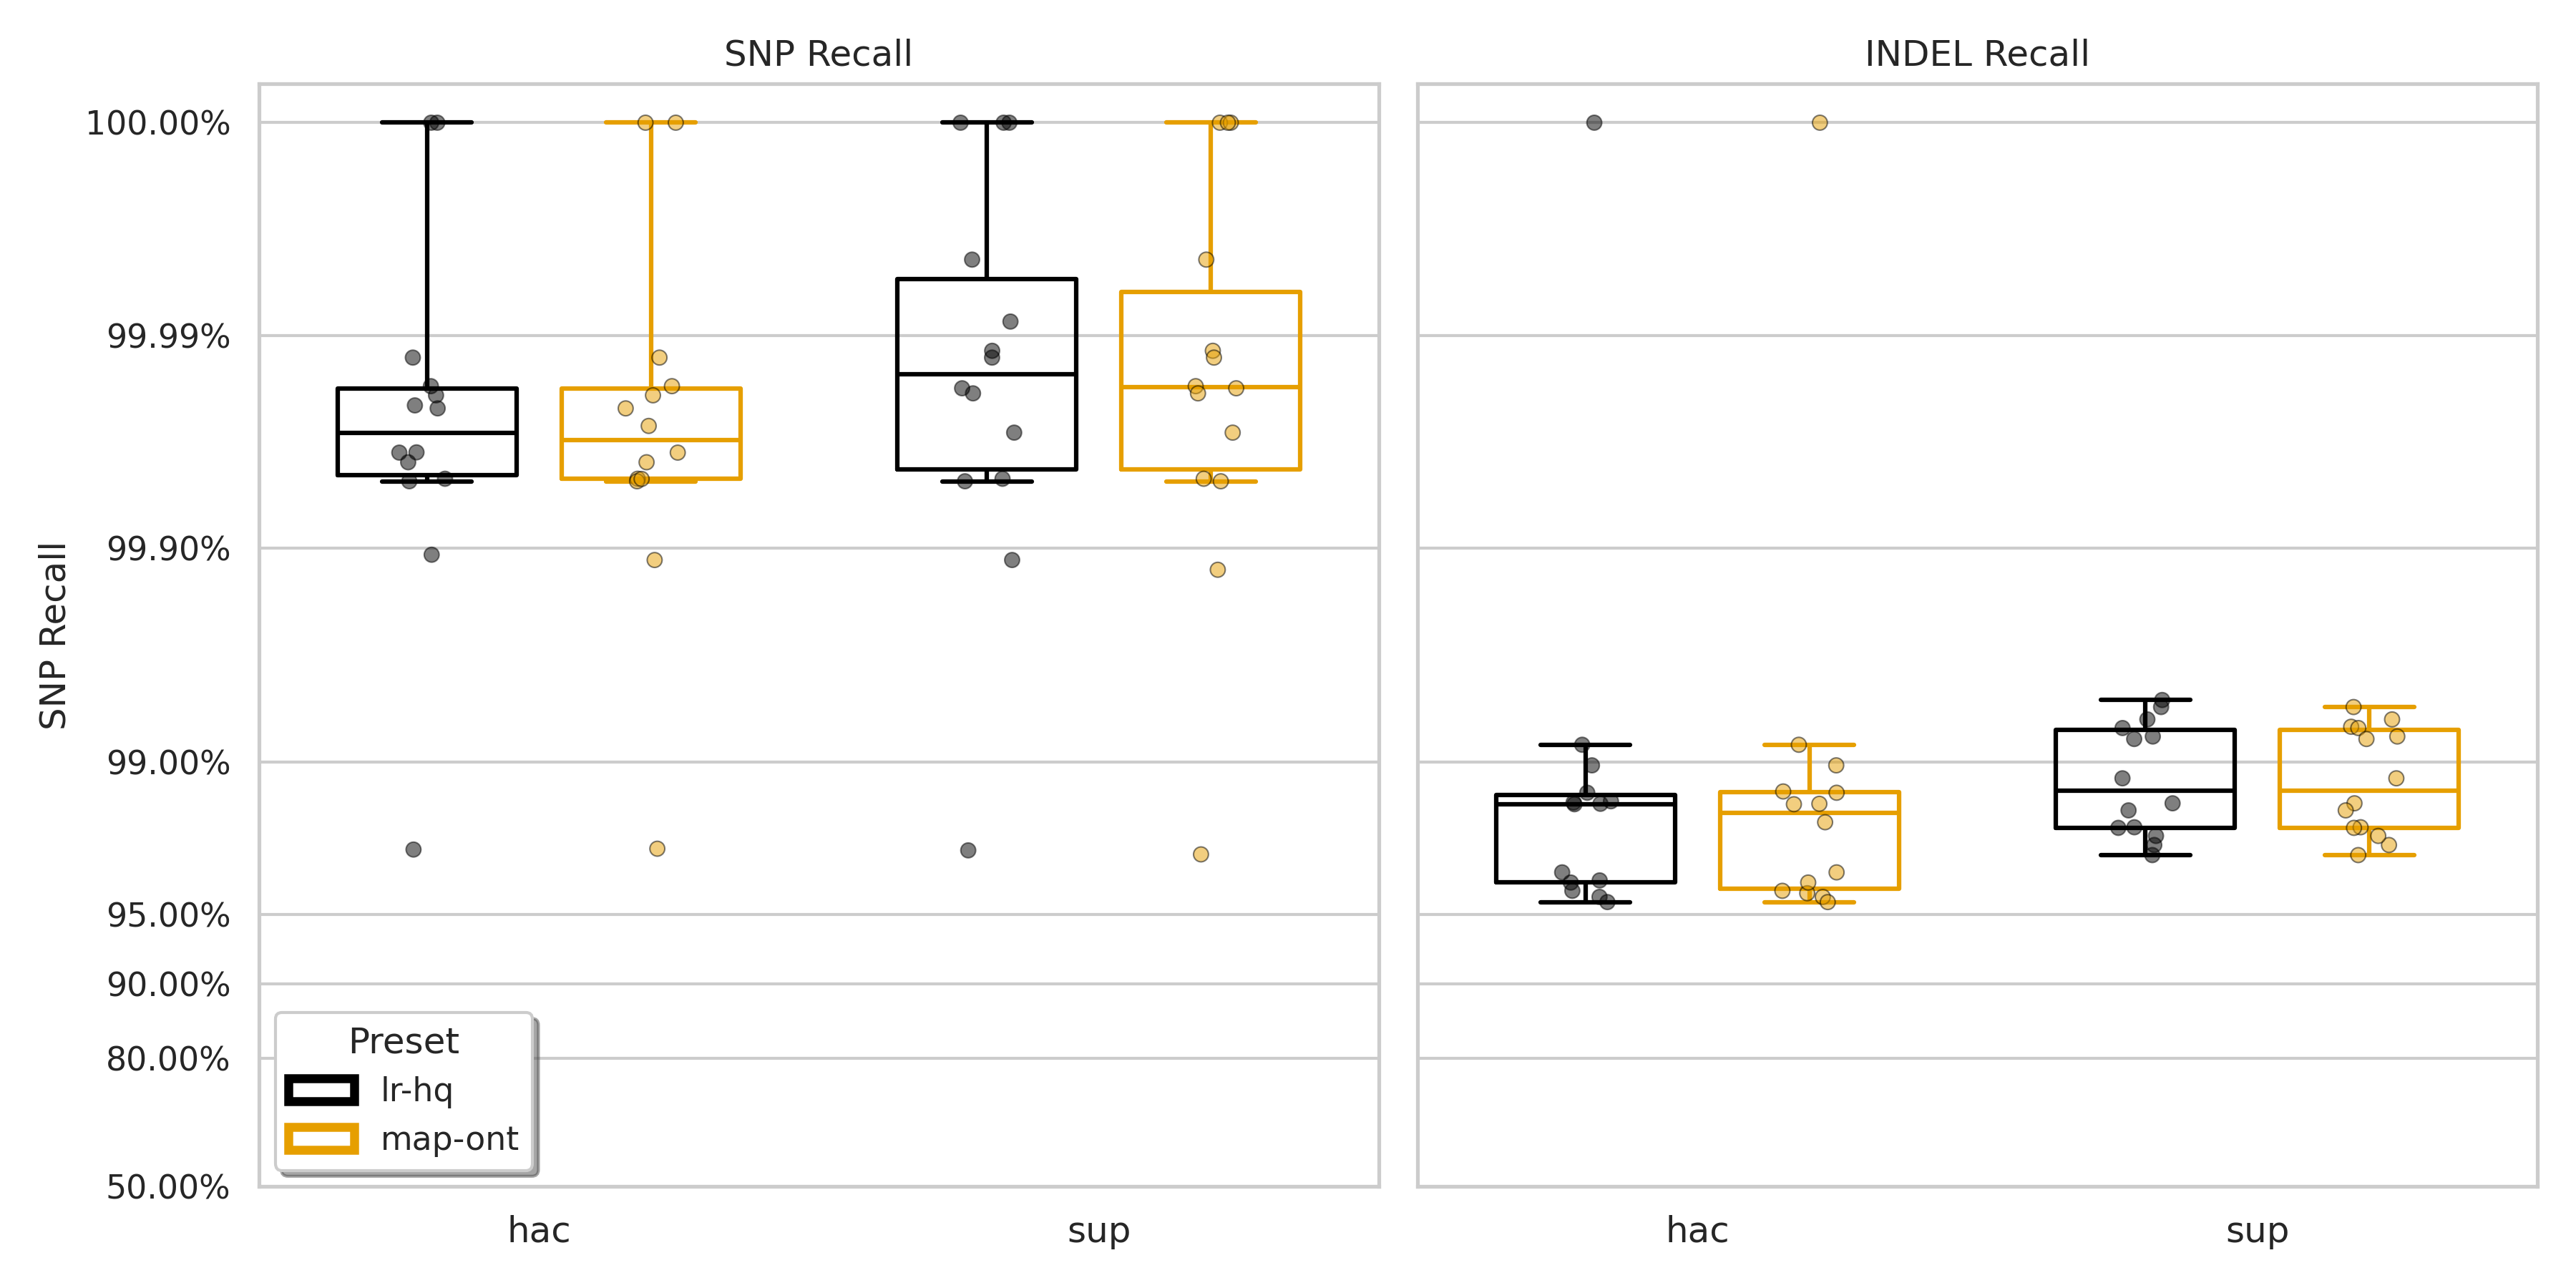
Figure S2: Recall for SNPs (left) and indels (right) for minimap2 presets lr:hq (black) and map-ont (orange).
Raw data for the above Table S1.
Scripts
The following scripts detail the complete pipeline used to generate the data for this analysis.
Config file
1. Download Data
2. Subsample Reads
3. Align Reads
4. Variant Calling
5. Assessment
6. Aggregation and Plotting
7. Helper Scripts
The $2/(w+1)$ statistical retention rate is a fundamental property of the minimizer (or winnowing) algorithm, formalised by Schleimer et al. (2003) and Roberts et al. (2004) and dictates k-mer sampling density [5, 6]. When a window of size $w$ slides forward by one position, the algorithm is effectively evaluating a combined pool of $w+1$ k-mers (one dropping out, $w-1$ shared between windows, and one entering). Assuming a (relatively) random DNA sequence, the chosen minimizer will only change if the absolute lowest hash value in that entire $w+1$ pool sits at one of the two ends: either the k-mer that just exited the window (probability $1/(w+1)$) or the new k-mer that just entered (probability $1/(w+1)$). Summing these mutually exclusive events gives the $2/(w+1)$ probability that a new seed is saved. Therefore,
map-ont($w=10$) retains 2/11 (~18%) of its k-mers as minimizers, whilelr:hq($w=19$) retains 2/20 (10%). ↩︎ ↩︎The F1 Q-score is the Phred-scaled equivalent of the standard F1 score, calculated as $-10 \log_{10}(1 - F1)$. This is useful when variant calling accuracies exceed 99.9%, as comparing linear F1 scores (e.g., 0.9990 vs 0.9999) becomes visually and intuitively difficult. Applying the standard Phred scale converts these fractional monstrosities into simpler logarithmic integers—for instance, an F1 of 0.999 becomes Q30, and 0.9999 becomes Q40—making microscopic differences in pipeline performance much easier to quantify. ↩︎ ↩︎
Cite this post
Hall, M. B. (2026). Minimap2 lr:hq preset testing. mbhall88.github.io. Zenodo. doi:10.5281/zenodo.19717304
View BibTeX
@misc{hall2026index,
  author = {Hall, Michael B.},
  title = { Minimap2 lr:hq preset testing },
  year = { 2026 },
  howpublished = { \url{ https://mbhall88.github.io/post/minimap2-lrhq-preset-testing/ } },
  publisher = { Zenodo },
  doi = { 10.5281/zenodo.19717304 }
}
References
- Li, H. (2018). Minimap2: pairwise alignment for nucleotide sequences. Bioinformatics. [doi:10.1093/bioinformatics/bty191]
- Hall, M. et al. (2024). Benchmarking reveals superiority of deep learning variant callers on bacterial nanopore sequence data. eLife. [doi:10.7554/eLife.98300]
- Zheng, Z. et al. (2022). Symphonizing pileup and full-alignment for deep learning-based long-read variant calling. Nature Computational Science. [doi:10.1038/s43588-022-00387-x]
- Dunn, T. et al. (2023). vcfdist: accurately benchmarking phased small variant calls in human genomes. Nature Communications. [doi:10.1038/s41467-023-43876-x]
- Schleimer, S. et al. (2003). Winnowing. Proceedings of the 2003 ACM SIGMOD international conference on Management of data. [doi:10.1145/872757.872770]
- Roberts, M. et al. (2004). Reducing storage requirements for biological sequence comparison. Bioinformatics. [doi:10.1093/bioinformatics/bth408]